- Grading extent/size of disease
- small: 1-2 segments
- medium: 3-4 segments
- large: ≥ 5 segments
- Grading severity of disease is based on depth
- small: 1 level
- moderate: 2 levels
- large: 3 levels
 Figure Caption: Polar map division according to Cedars-Sinai Medical Center software. Top left: polar map division based on arteries; top right: division based on coronary artery groups. In the polar map divided according to arteries, the areas which cannot be unequivocally assigned to the supply area of a particular coronary vessel due to variable vascularization are blackened. LAD – left anterior descending branch, Cx – circumflex branch, RCA – right coronary artery. Bottom: left ventricular polar map division into 17 segments according to the American Heart Association. The order in which the segments are numbered is counterclockwise. Basal segments are numbered 1–6, midle segments: 7–12, and paraapical segments: 13–16. The figure also assigns the segments to particular coronary artery groups. The area assigned to the left anterior descending artery and its branches is marked with blue; the group of segments assigned to the circumflex artery and its branches is marked with yellow, and the right coronary artery group is marked with red. It should be noted that the assignment of the polar map segments to specific coronary arteries is approximate and schematic; it may vary depending on the type of left ventricular vascularization.
ECG Patterns of MI
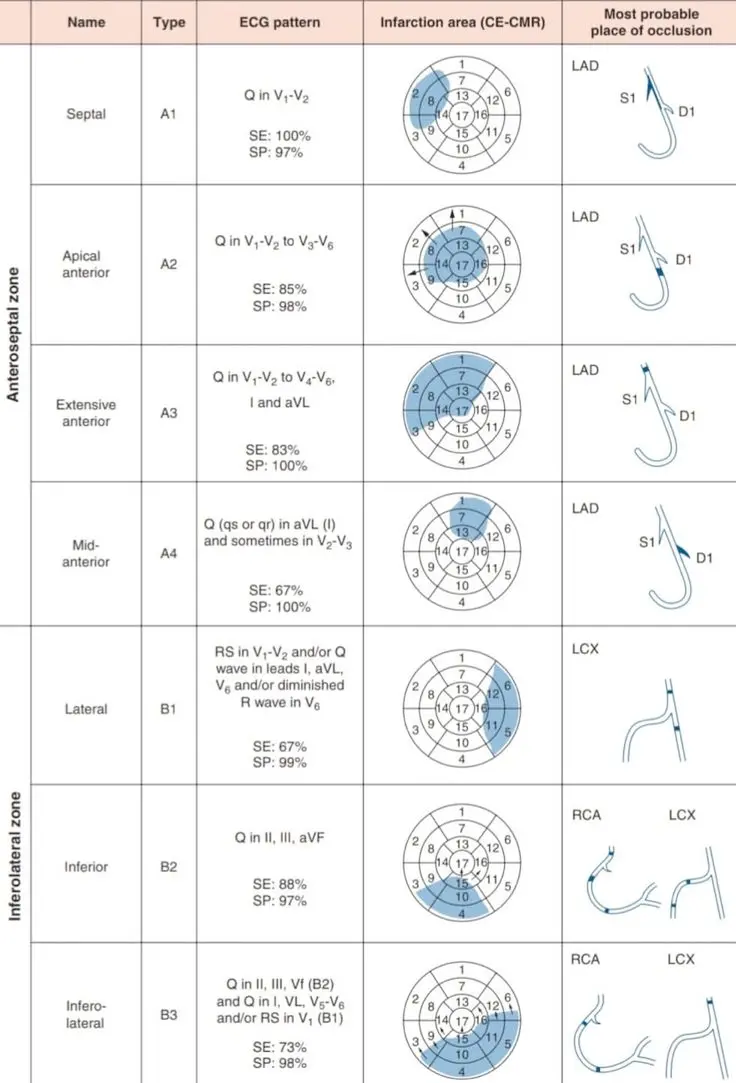 Caption: ECG patterns of Q-wave/Q-wave equivalent myocardial infarction on the 17-segment model of the left ventricle, with the names given to the infarcted left ventricular regions documented by cardiac myocardial resonance imaging. The 4 MI regions in the anteroseptal zone are designated as A1, A2, A3, and A4; the 3 MI regions in the inferolateral zone are designated as B1, B2, and B3.
Grading of MPI PET and SPECT Imaging
- Polar maps
- Represent a 2D compilation of all the 3D short-axis perfusion data.
- transformation of the 3D tomographic image of left ventricular perfusion into a overlayed 2D image
- Division of Polar map using the Cedars-Sinai software
- Represent a 2D compilation of all the 3D short-axis perfusion data.
- Use of the 17 segment model (similar to Echo)
- Location
- Extent/Size
- small (1-2 segments), medium (3-4 segments), large if ≥5 segments involved
- Severity
- based on depth: 0, 1 (mild), 2 (moderate), 3 (severe)
- Reversible
- reversible, partially reversible, fixed
- If the stress-induced regional perfusion defect persists on the corresponding paired rest images, it suggests the presence of an irreversible myocardial injury. On the other hand, if the defect on the stress images resolves completely or partially on the rest images, it suggests the presence of stress-induced myocardial ischemia.[^asnc]
- Infarct versus Ischemia
- Comparing the location, extent, and severity of perfusion deficits during stress and rest
- Reversible defects are indicative of stress ischemia
- Sperry likes to use the Summed Rest score (defines infarct) and Summed Difference score (ischemia)
- Global scoring of myocardial perfusion uses measures such as: the Summed Stress Score (SSS), the Summed Rest Score (SRS), and the Summed Difference Score (SDS)
- SSS is the sum of the individual scores from the 17 segments of the polar map obtained during stress
- SDS = SSS – SRS
- used to describe the degree to which the deficit/ischemia is reversible
- Comparing the location, extent, and severity of perfusion deficits during stress and rest
- Total Perfusion Deficit (TPD)
- calculated based on both the extent and severity of ischemia
- TPD is equivalent with the polar map’s segmental perfusion score, but it differs in that it is a constant value that does not pertain to the individual segments 1
- Stress TPD: ischemic
- Rest TPD: infarcted
- Example statement
- “There are large and severe reversible perfusion defects anteriorly and laterally.”
- “There is a moderate-sized severe reversible perfusion defect of the inferior and inferoseptal walls, in the distribution of the known occluded right coronary artery.”
| SSS | SS% | SDS | TPD (%) | Result |
|---|---|---|---|---|
| < 4 | < 5 | < 2 | < 5 | Normal or minimally abnormal result |
| 4–8 | 5–9 | 2–4 | 5–9 | Mildly abnormal result |
| 9–13 | 10–14 | 5–6 | 10–14 | Moderately abnormal result |
| > 13 | > 14 | > 6 | > 14 | Significantly abnormal result |
Footnotes
-
Czaja M, Wygoda Z, Duszańska A, et al. Interpreting myocardial perfusion scintigraphy using single-photon emission computed tomography. Part 1. Polish Journal of Cardio-Thoracic Surgery. 2017;3:192-199. doi:10.5114/kitp.2017.70534 ↩